

Rush Enterprises ($RUSHA)
A Competitively Advantaged Commercial Vehicle Dealer

Recommendation: Long Market Cap: 4.33B Share Price: $55.4
Enterprise Value: 4.74B EV/EBIT: 9.4x Date: 12/20/2024
Company Overview
Rush Enterprises is a full-service, integrated retailer of commercial vehicles and related services founded in 1965 by Marvin Rush. The company operates a vast network of over 125 franchised Rush Truck Centers (RTCs) across 23 states in the U.S., as well as 80% ownership over 14 locations in Canada. They hold around 6% market share in the U.S., in a highly fragmented industry, with no other competitor holding any significant market share. Rush primarily sells commercial vehicles manufactured by Peterbilt, International, Hino, Ford, Isuzu, IC Bus, Blue Bird, and Dennis Eagle. They offer new and used commercial vehicle sales, aftermarket parts sales, service and repair facilities, financing, leasing, rental options, and insurance products through their locations. Of these business lines, the most important is the aftermarket Products and Services segment, which accounts for 33% of revenue and 61% of gross profit. This is a more stable source of revenue compared to new and used vehicle sales, which account for 62% of revenue and only 30% of gross profit.
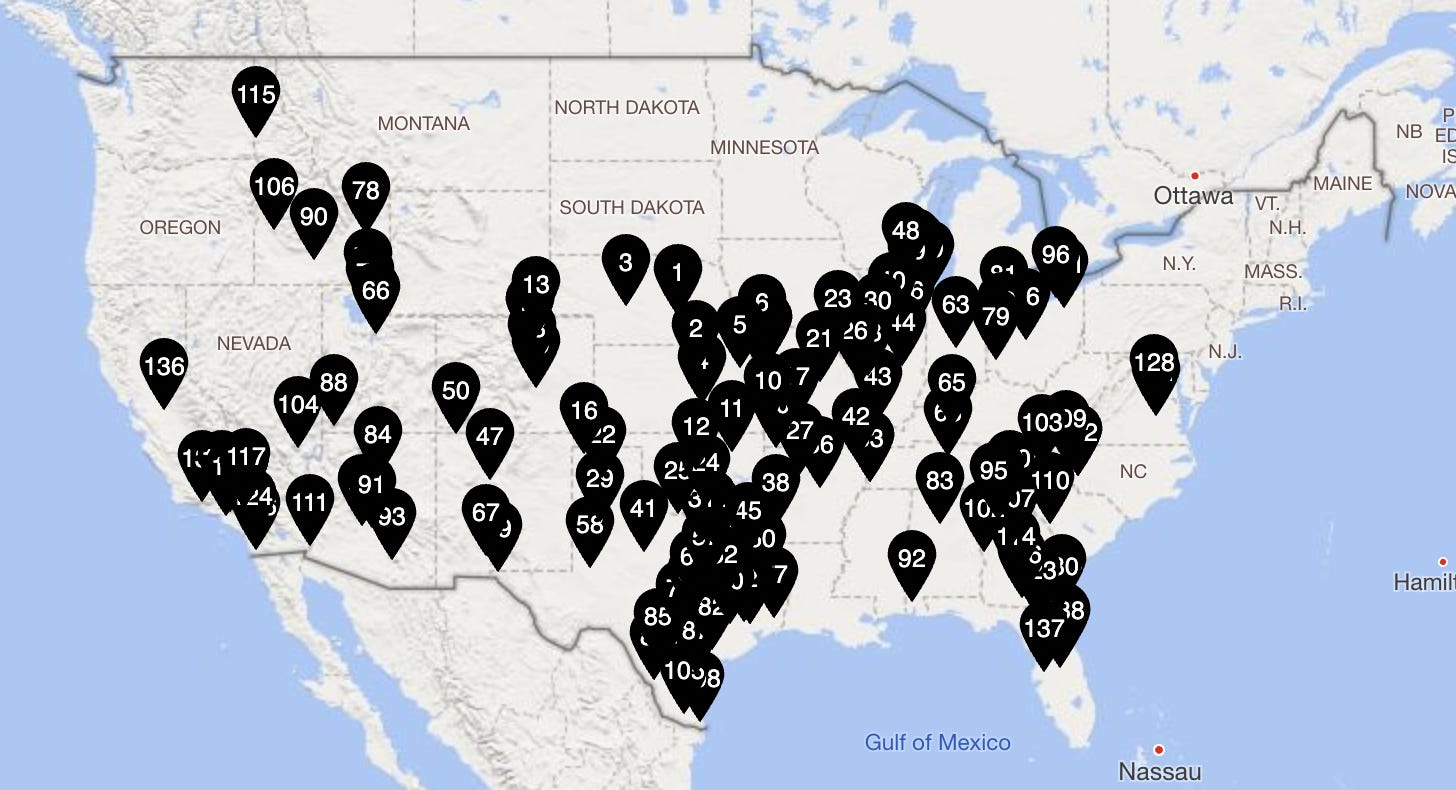
Figure 1.1 – U.S Locations
Key Metrics
The most important metric for Rush, which is unique for their industry, is their absorption ratio. This is calculated by dividing the gross profit from the parts, service, and collision center departments of a dealership by the overhead expenses of all of a dealership’s departments, except for the selling expenses of new and used commercial vehicles and the carrying costs of the new and used commercial vehicle inventory. In short, this ratio measures how much of a dealership’s fixed expenses (i.e. non-vehicle sales-related expenses such as commissions and carrying costs of new and used vehicles) is covered by a dealership’s gross profit from parts and service. A dealership with a higher absorption ratio will – all else equal – be less cyclical than one with a lower absorption ratio. On average, well-run automotive dealerships operate at a 75% absorption ratio, with larger peers like Penske and Group 1 achieving 125%. By contrast, RUSH operates at almost a 136% absorption ratio, which has grown steadily from 100% since they started reporting it in 2006. This means that on every dollar of non-vehicle sales-related expenses, the average automotive dealership generates $.75 in gross profit from parts and service, while Rush generates $1.36.
Another unique piece of the dealer business model is floor plan financing (FPF), where Rush finances the inventory on its dealership lots instead of paying for it upfront. FPF is done through banks, BMO Harris in this case, when inventory is held for over 60 days. For inventory held less than 60 days, the manufacturers provide an interest-free stocking period and do not require payment. Although FPF gets recorded as short-term debt on the balance sheet, it’s fundamentally a working capital liability – interest-bearing accounts payable – secured by the vehicles themselves. When adjusting for this, Rush’s net debt to EBITDA ratio is less than .4x, after-tax ROCE is 20%+, while the business is more free cash flow generative than it seems. Some investors argue that Rush’s management has actually been overly conservative and that they are the most overcapitalized among their peer group, arguing that they should take on more leverage to buy back shares. In reality, this seems like an unlikely scenario, but speaks to Rush’s strong financial position.
Business History
1965
Marvin Rush founded the company, running a single GMC dealership in Houston, with the vision to grow the company into a contiguous network of dealerships across the southern U.S, while the overall commercial vehicle industry is still in its infancy
1967
Made its first 100-unit fleet sale of Peterbilt trucks and opened a Peterbilt dealership, the start of an enduring relationship with this premium manufacturer
Marvin also grows the company’s offerings by starting a truck leasing company and a finance and insurance division, offering one-stop sales and service.
1992
The company exceeded $100 million in revenue with the goal of reaching $1 billion in annual revenue and began an intense period of acquisition and expansion that would last for over twenty years.
Since 1992 each employee has also received an engrained coin with their motto “The Customer is the Boss” and their core values of Productivity, Fairness, Excellence, and Positive Attitude.
1996
Lists on the NASDAQ under the symbol RUSH in June, making it the first dealer to go public
Rapid growth continued with additional Peterbilt dealerships in multiple states, including acquisitions in Arizona, California, Colorado, Florida, New Mexico, Oklahoma, Tennessee and Texas
2003-2005
Added medium-duty truck franchises across the network, representing Hino, Isuzu, and UD, expanding the breadth of our product offerings
In 2004 it exceeded $1 billion in revenue, reaching the ambitious goal set by the company just over a decade before, and completed its second public offering.
Later in 2006, the company acquired its first Ford location, in Denver, Colorado.
2006
Marvin’s son, W.M. “Rusty” Rush, became the President and Chief Executive Officer of Rush Enterprises, a position he holds to this day, sharing his father’s work ethic and vision for the company.
2008-2014
Acquired its first Navistar® dealerships, with nearly 80 to be added in the ensuing years. Today, Rush Enterprises is the largest Navistar dealer in the country
Expanded its medium- and light-duty offerings, adding Mitsubishi Fuso and Ford locations as well as independent used truck outlets across the country
New businesses came on board, with Rush Bus Centers and Rush Towing Systems making their debuts followed by the establishment of Custom Vehicle Solutions
2015
Further committed to its vehicle aftermarket business with the launch of the RushCare portfolio of services
Introduced Momentum Fuel Technologies, later entering into a joint venture with Cummins® in 2022 and repositioning Momentum as Cummins Clean Fuel Technologies.
Issued a second special 50th-anniversary coin for all employees.
2019
Purchased 50% of the Tallman Group, extending our dealership network presence into the Canadian market, later expanding to own a 50% interest in what is now called Rush Truck Centres of Canada Limited.
2021
Closed on an acquisition of 17 dealerships in the South and Midwest from The Summit
Truck Group, further enhancing the support offered to customers across North America.
2024
Annual revenues exceed $7 billion. Rush Enterprises spans more than 200 dealership + affiliate business locations with 8,000 employees across North America.
Dedicated to expanding the suite of leading technologies and solutions it offers customers and strengthening its position as the premier solutions provider to the commercial vehicle industry.
Dealership Industry
The dealer industry as a whole performed very well post-WWII, driven by consolidation at the OEM level and greater consumer demand for vehicles. In the late 1990s, large dealership groups began going public. Rush was the so-called pioneer of this trend, IPOing in June of 1996, followed by Litha and Penske within 6 months. In the following year, Sonic, Group 1, and Carmax joined them with Autonation in 1992 and Asbury in 2002. Many other dealership groups also went public at this time but were either taken private or bought up by other players. Since their IPOs, these 8 dealership businesses have performed very well as a group, benefiting from similar tailwinds. Interestingly enough, the number of dealerships in the U.S. has been decreasing for almost a century, peaking at 52,125 in 1927 and steadily decreasing over the next decades. By 1960, there were 33,658 dealerships; by 1980, 23,379; and by 2001, just 22,007. In 2023, this figure was just 18,000, decreasing 0.8% from. Total units sold in the U.S. have stayed relatively flat since the 1980s, but the entire vehicle fleet as a whole has been steadily increasing, driving greater demand for parts and service. Essentially, the unit economics of all dealerships have improved substantially, with higher vehicle sales per location and a greater share of revenue coming from parts and services. Since going public, these major dealership groups have taken advantage of these tailwinds to rapidly grow their share of this very fragmented market.
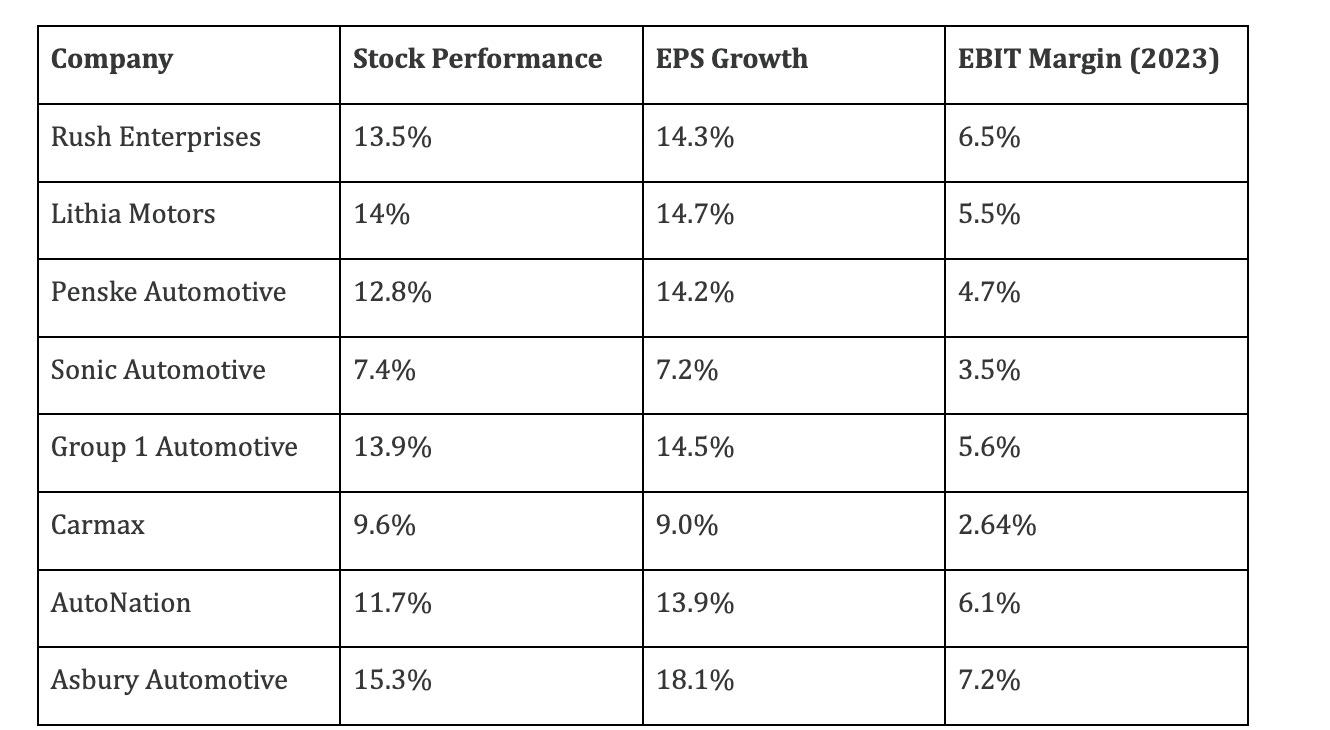
Figure 1.2 – Peer Group Performance
(Stock performance and EPS are expressed as a 20-year CAGR)
Dealers across both the commercial and automotive space have enjoyed higher gross profits per unit post-COVID. This trend has lasted until the present day, with most citing it as a structural change in the industry. At Gabelli Fund’s 48th annual symposium, they briefly discussed this dynamic, stating that from an investing standpoint, they continue to greatly favor the dealership business model given the resilience this group has shown throughout all economic realities throughout the last 5 decades. All of the major public dealers have been able to adjust, adapt, and overcome through the pandemic and the financial crisis, coming out as more profitable entities on the other side. Gabelli, like others, seem to believe that the lessons learned from 2020 and 2021 at both the dealer and OEM levels mean that dealers will be able to maintain some of their margin expansion over the long term. In the past year, gross margins have contracted a percentage or two across the board for most dealers but show signs of stabilization. The OEMs have also been working with dealers to reduce inventory levels, increase turns, and rationalize pricing, ultimately boosting ROIC and free cash flow generation. In effect, this has brought with it a new age of aggressive M&A and share repurchases among the public dealer peer group.
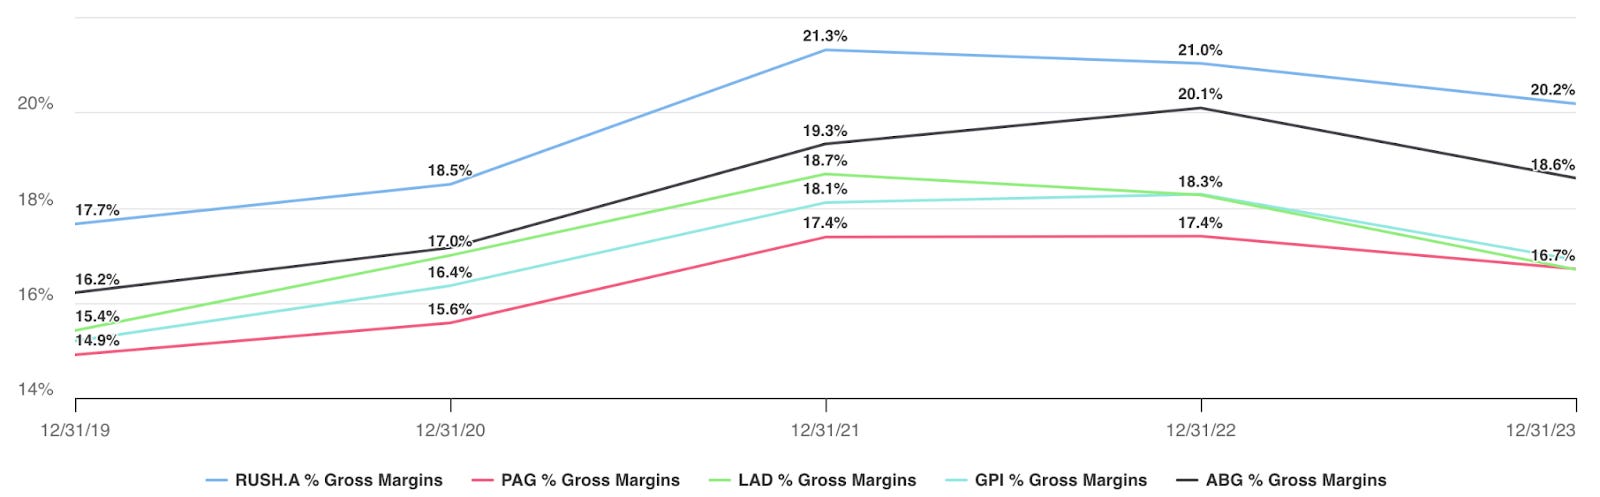
Figure 1.3 – Post-Covid Gross Margins
(used vehicle dealers excluded for better comparison)
Commercial Vehicle Industry
Commercial vehicle dealerships, similar to automotive dealerships, exist due to regulations that prevent OEMs from selling directly to the end customer and competing directly with their franchise partners (ie. the franchise law). 72% of all transport-related revenue in the United States comes from trucking and the trucking industry overall is highly correlated with GDP growth. Other forms of transporting goods like rail, air, and water are lower growth markets and closer to maximum capacity. Therefore, most of the growth in transportation falls to trucking. Those that service and supply parts for trucks are in a good position as the economy continues to grow. The industry has grown parts and services revenue at 8% (per dealership) from 2016 to 2023, 3% faster than GDP growth during this period, while the overall number of vehicles in fleets has grown much slower.
The commercial vehicle industry also differs from the automotive industry in that there are just 7 heavy-duty truck manufacturers in the United States, which together have 99.9% market share. These manufacturers include Freightliner, Western Star, Peterbilt, Kenworth, International, Volvo, and Mack. Furthermore, there are technically just parent companies behind all 7 of these brands. These companies are Daimler (Freightliner and Western Star), Paccar (Peterbilt and Kenworth), Navistar (International), and Volvo (Volvo and Mack). Comparatively, on the automotive side, there are 14 parent companies responsible for several dozen brands together. Trucks are also much more technologically complex, tougher to manufacture and service, face stricter regulations, and are subject to much more wear and tear through use than autos. All of these dynamics together have made the commercial space more better on average, providing dealers with a more stable industry backdrop. The dynamics of this industry also make it so commercial OEMs are considerably better businesses themselves compared to their automotive counterparts.
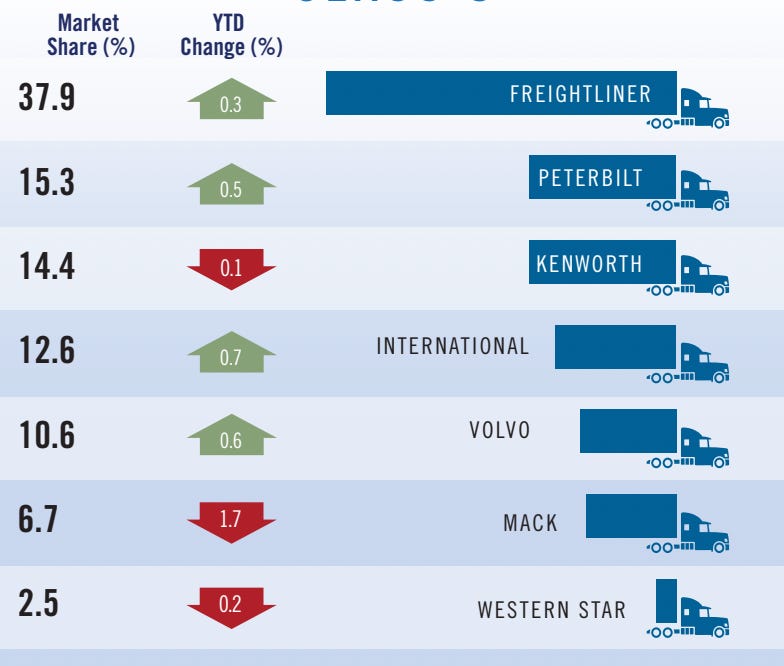
Figure 1.4 – Class 8 Vehicle Market Share
New commercial vehicles sales are also cyclical, following freight rate cycles and emissions regulations. Currently, it seems that we are somewhere near the bottom of the cycle, with many people in the industry forecasting a cyclical uptick in new vehicle sales derived from a wave of new emissions regulations coming soon. This phenomenon happens because once new laws are passed, non-compliant trucks have to be put out of service, and fleet operators have no choice but to purchase new trucks to maintain their operations. Then, over time, new sales drop off as demand is no longer artificially inflated while the customers reassess the viability of these new trucks. The government comes out with major regulations about every 5 years, which is how long cycles have lasted in the past. Over time, Rush has insulated its business from cycling by growing the parts and services portion of their business, which can be seen in their historical ROIC, where they’ve had higher lows throughout the cycles.
Competitive Position
In terms of competition, Rush competes primarily with other dealerships selling vehicles from competing manufacturers like Mack, Freightliner, Kenworth, and Volvo. The manufacturers themselves won’t grant franchises to dealerships in close proximity. For example, you’ll never rarely ever see a Peterbilt dealership competing with another Peterbilt dealership within a 50-mile radius, as they recognize the local scale required for dealerships to succeed. In defining their competitive advantage, I see a combination of local economies of scale, protected by barriers of entry established by the OEMs, along with a degree of customer captivity driven by proprietary part sales and a wide network of RTCs. Through this wide network, they have also been able to maintain a strong customer base, who appreciate the standardized experience at RTCs across the nation.
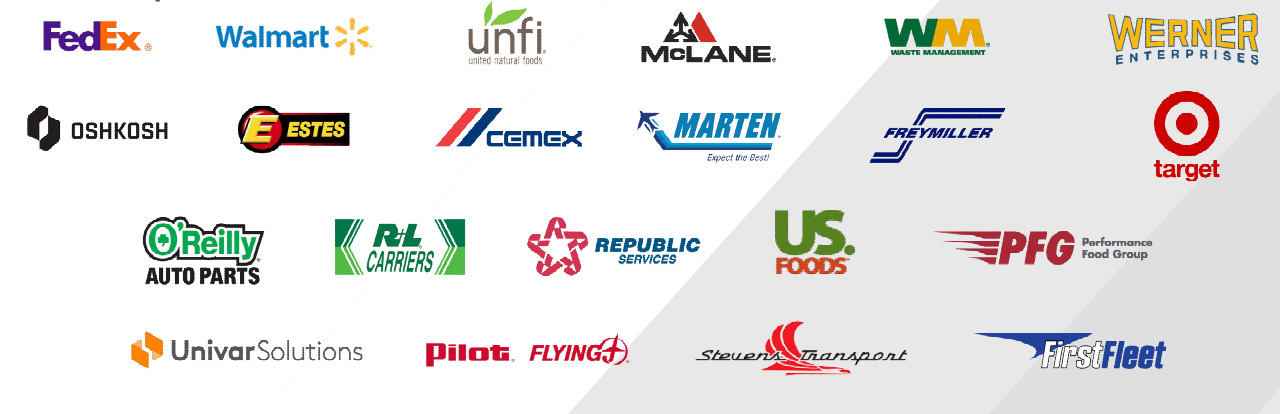
Figure 1.5 – Class 8 customers
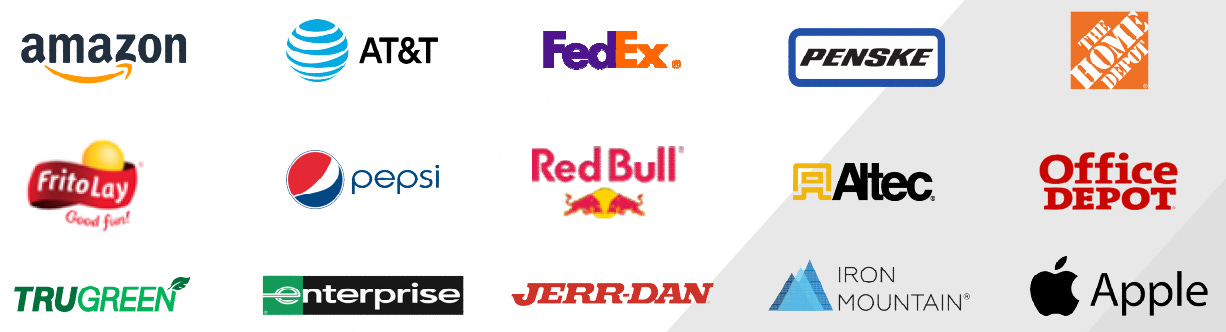
Figure 1.6 – Class 4-7 customers
Another differentiating factor for Rush is the very close relationship they have with Peterbilt, who they have worked with since the late 1960s. In 1965, Peterbilt released its 358 model, which was its first mass-manufacturing truck to gain meaningful traction just two years before Rush opened its first Peterbilt location. The release of the 358 marked the beginning of the Peterbilt as we know it today, with it being the first to bear their iconic bird hood ornament and current logo. Essentially, Rush and Peterbilt have grown alongside one another, with each being the other's most important counterparty for most of their history. The current CEO, Rusty, maintains this decade-long relationship handed down to him by his father, Marvin, working very closely with each of Rush’s OEMs. Maintaining these relationships allows Rush to more easily secure and maintain adequate inventory levels for vehicles and parts.
Scale Economies
Another piece of Rush’s competitive advantage is its unmatched scale. The main benefit of scale unique is higher customer retention, from being able to better service larger fleet operators throughout all of their longer routes. They are also able to drive down per-unit costs and move part inventory more quickly from location to location, using better distribution to improve their turn-around times, a crucial metric in this business. On the used vehicle side, Rush can absorb large trade-ins from the massive fleets they work with across their dealer network. If these companies want to trade in a meaningful proportion of their fleet, which is spread out around the country, Rush is the only player that can handle all of that inventory, and who has the dealer network to accept trade-ins across their different markets. As such, Rush enjoys lower used vehicle acquisition costs and on the flip side, can earn higher GPUs (gross profit per unit) when selling. Another situation that arises is when a larger fleet wants to purchase many trucks at once in a single market or multiple markets around their region, which can only be accomplished through Rush.
Parts & Service Business
Commercial OEM parts, although sometimes more expensive, show increased performance for vehicles and better longevity over aftermarket parts. Larger fleets that have higher budgets show strong preferences for these OEM parts over alternatives. These fleets (think FedEx, Amazon, Walmart, Target, etc.) use in-house mechanics to service their vehicles, mainly just acquiring parts from Rush. On the service side, their primary customers are smaller fleets who choose not to employ in-house mechanics. This is a major area where I foresee growth as overall share shifts from DIY to DIFM in the parts and service market for commercial vehicles Over time, Rush should gain more and more business on the service side from these fleets.
Rush has an insulated competitive position due to its place in the OEM channel. Considering the strong Rush-Paccar relationship, RTCs differentiate themselves from aftermarket parts businesses like Fleetpride, Truckpro, NAPA’s commercial stores, and dealerships serving other OEMs. An unusually high proportion of the parts within commercial vehicles are proprietary to the manufacturer, meaning certain Peterbilt parts cannot be replaced with generalized aftermarket parts or parts from other OEMs. If a fleet operator needs one of these proprietary parts, they are forced to go through the OEMs channel. This is very important considering that for any given OEM, there’s usually only one dealership covering a 50-100-mile radius. Additionally, PACCAR and other commercial OEMs manufacture more of their parts than automotive OEMs, choosing only to use 3rd party part suppliers for less important, non-proprietary parts. Proprietary parts give these OEMs greater pricing power while providing their dealerships with strong competitive advantages.
Rush also acts as a distributor of commercial vehicle parts through their ordering system. For each of their OEMs, they are the individual biggest purchaser, which allows them to benefit from volume purchases at favorable prices. They then turn around and sell a proportion of their non-proprietary branded parts to aftermarket providers, essentially acting as a buying agent. Although this area of this business has limited disclosure, it’s a material part of their parts and service revenue and partly explains why under-warranty revenue is so low.
Management Structure
One thing that stands out about Rush is their company culture and management team, which have both been praised by people across the industry. The incentives are very aligned both on the corporate level as well as the dealership level, with general managers in place who are heavily compensated based on their performance. Rush also employs regional managers, who fall above the general managers. An interesting thing about these regional managers is that they still serve as general managers, in addition to overseeing the broader RTC network immediately around them. The main difference is that they manage the biggest Rush location in their respective areas, which acts as the hub location and can be anywhere up to 90,000 square feet. The average RTC occupies about 30,000 square feet of real estate without excluding their numerous hubs, meaning that the spokes locations are smaller than this. This decentralized hub and spoke model allows for more efficient distribution of both vehicles and parts, ensuring the greatest average speed of delivery across their entire dealership network, while also becoming stronger with each incremental location Rush gains.
Turning to the executives, Rusty Rush (CEO) owns 11% of the company (and through super-voting shares, holds a 39% voting interest). He has over a 30-year tenure as CEO and President, having grown up in the business and working under his father since he was a teenager. Rush Enterprises represents the culmination of his and his father’s hard work, who have both spent the majority of their lifetime growing the business. People describe him as a “unique cat”, who has an intense passion for the business, while not in the least promotional towards investors. The success he has built through has earned him a lot of respect in the industry, with customers and OEMs alike looking up to him. Even competitors view Rush Enterprises as a “very professional and high-quality organization” or a “good, tough, fair competitor, doing business they way it should be done”. The executives include Steven Keller (CFO) Jason Wilder (COO) and the various group heads for business lines. All of these people have been promoted internally, with some even starting as general managers.
Capital Allocation
Rush has had shareholder-friendly throughout its public history. They pay a steadily growing dividend, currently at an 18% payout ratio, and have repurchased a decent amount of shares, with the amount accelerating over the last few years (e.g., $60M avg. 2018-2021, $102M in 2022 and $219M in 2023). In 2023, annual shareholder distributions totaled 6% of the market cap consisting of a 1% dividend and 5% buybacks, which have been accelerating year over year. However, during more acquisitive years, this buyback is likely to get cut, as they can acquire private dealerships at lower multiples than their own stock. This means it’s probably unfair to assume that both the 2-5% annual buybacks and mid-single-digit inorganic growth can coexist, especially when considering 2023 was a slow year for Rush’s opportunistic acquisition strategy. But the fact that management chose to ramp up share buybacks significantly, while their stock traded between 8-10 times normalized earnings between 2022 and 2023 is a positive signal that they can be trusted to pursue whichever strategy generates the highest incremental returns.
Thesis Overview
The thesis on Rush Enterprises can be summarized by improving unit economics at the individual dealership level due to strong business tailwinds, coupled with inorganic industry consolidation, creating an attractive growth profile and reinvestment runway. In effect, this will drive low double-digit free cash flow growth for many years to come while potentially accelerating share buybacks, and small but growing dividends will generate further shareholder returns. All of this comes in a fundamentally overcapitalized balance sheet, a strong company culture, and a very capable, well-aligned management team.
Organic Growth
The main tailwind driving organic growth will be the technological advancement of commercial vehicles through factors like increased computers, sensors, and cameras per vehicle, along with broader shifts towards stricter emissions regulations. This will benefit large, more technologically sophisticated players like Rush, allowing them to steal business from smaller mom-and-pop aftermarket parts and repair shops that lack sensor calibration tools and skilled technicians to address the evolving vehicle fleet. Even medium-sized fleets are increasingly choosing not to retain their own mechanics due to increasing vehicle complexity and a lack of talent. Along with this, consolidation at the fleet operator level will also drive Rush’s parts business, as larger fleets show a clear preference for working with Rush due to their vast network of RTCs and quick turn around or part delivery times. Another of the industry is the aging vehicle fleet, up from 11.4 years in 2014 to 14.74 in 2024 on average, along with greater miles driven per vehicle and a growing fleet overall, leading to the need for more parts and higher absorption ratios. Overall, these dynamics will likely drive mid to high single-digit organic growth in the service and repair business while the new and used truck sales business grows slightly faster than GDP.
Inorganic Growth
The other key piece in the thesis is the roll-up strategy they have been employing, mirroring the strategies employed by peers like Lithia and Penske in the automotive industry. For the past two decades, Rush has been growing their location count by about 4% each year, and at just 6% U.S. market share, they have significant whitespace left to capture as the only pure-play commercial dealership rolling up the industry on a national scale. This 4% may understate true inorganic growth, given that Rush has also been combining some smaller RTCs to create larger RTCs, effectively reducing location count while still growing square footage, parts inventory space, and service bays. Rush has a dominant position in the commercial vehicle segment, proving them a good base to consolidate the industry. As they grow market share, I expect Rush to become an even better business due to the benefits of scale they enjoy. Unlike typical consolidation plays where acquisition multiples get driven up over time from competition and private equity interest, this sector benefits from inherent barriers to entry. Based on agreements and franchise laws, acquisitions in the dealership industry must be approved or allowed by the OEM. These OEMs are only concerned with the buyer’s ability to execute and provide satisfactory service to the end customer on their behalf. This ends up being a huge advantage for Rush over other players, as they have the most highly regarded management team in the entire commercial vehicle industry and have proven themselves to be the best operators.
Cyclical Recovery
A final consideration, although not as important for the thesis, is that new commercial vehicle sales will likely pick up in mid-2025 to 2026 as a wave of new emissions regulations take effect on January 1st, 2027. These regulations are expected to increase the cost of a Class 8 truck by at least $15,000, half of which consists of increased warranty costs. On top of this, the company believes the recent freight recession that has negatively impacted Class 8 truck sales is finding a bottom. With Class 8 inventory at an all-time high, Rush does see some improvement on the horizon as manufacturers have cut production, given the current freight environment. This will drive the cycle forward, boosting near-term earnings in the vehicle sales segment. Management has also been trying to counteract some of the cyclicality in freight cycles by increasing their exposure to vocational end markets, which are also much less cyclical (40-45% of Rush’s Class 8 customer mix).
Summary
Based on my thesis, I foresee mid-single-digit organic growth per location over the long term created by low to mid-single-digit growth in truck sales and mid-to-high single-digit growth in parts and service through the industry cycles. Conservatively assuming low to mid-single-digit inorganic growth from opening and acquiring new locations results in long-term free cash flow growth of around 9-11%. This comes at a 15x trough free cash flow multiple, along with a 1-3% annual shareholder distributions. I also see the durability of Rush’s growth as very attractive, considering the whitespace they have left to capture. If, for whatever reason, Rush is unable to pursue inorganic growth at such a high rate, I imagine they would allocate their excess free cash flow to dividends and share buybacks based on management’s actions. Although this would likely decrease my expectations for per-share free cash flow growth, I think the business still seems undervalued. Therefore, through my research, I see an attractive path to double-digit returns in Rush Enterprises under the same strategy that drove their incredible business performance in the past.
Risks
The main risk sell-side analysts cite is the trend towards electric commercial vehicles. OEMs have already begun manufacturing EVs designed for short-haul delivery in the class 4-7 segments. Compared to current trucks, these are expected to require fewer parts on an absolute basis, while the price of these parts and the cost to service these vehicles will be substantially higher. Whether or not this will hurt commercial dealerships has yet to be seen. Rush, on the other hand, may even benefit from electrification, which may drive more business to them on the service side. But, as of right now, the transition to EVs seems many years away and will require large-scale investments in charging stations. It will also take even longer for EVs to be economically viable in the long-haul Class 8 market, where Rush does most of its business. Other risks for the business include deteriorating relationships with OEMs, which may put pressure on Rush’s ability to acquire parts at favorable rates or a return. What may also happen is a reversion to pre-COVID margins if industry rationality decreases or if average gross profit per unit declines for commercial vehicle dealerships.